nvidia-smi dmon
This is NVIDIA’s Live device monitor
1
2
# gpu    pwr  gtemp  mtemp     sm    mem    enc    dec    jpg    ofa   mclk   pclk
# Idx      W      C      C      %      %      %      %      %      %    MHz    MHz
|Column|Meaning|
|—|—|
|gpu|GPU index, here 0|
|pwr|GPU power draw in watts|
|gtemp|GPU core temperature|
|mtemp|GPU memory temperature; - means unsupported/not reported|
|sm|Streaming Multiprocessor/core utilization|
|mem|memory controller/bandwidth utilization, not VRAM used|
|enc|NVENC video encoder usage|
|dec|NVDEC video decoder usage|
|jpg|JPEG engine usage|
|ofa|Optical Flow Accelerator usage|
|mclk|GPU memory clock|
|pclk|GPU graphics/core clock|
My machine has
1
2
3
4
5
6
7
pwr:   34–59 W
gtemp: 72–77 C
sm:    3–53 %
mem:   1–19 %
enc/dec/jpg/ofa: 0 %
mclk:  5501 MHz
pclk:  1515 → 1710 MHz
Important gotcha is 19% mem doesn’t mean “19% of 8GB memory is being used”. Instead it means 19% of memory controller / memory bandwidth is busy
nvtop
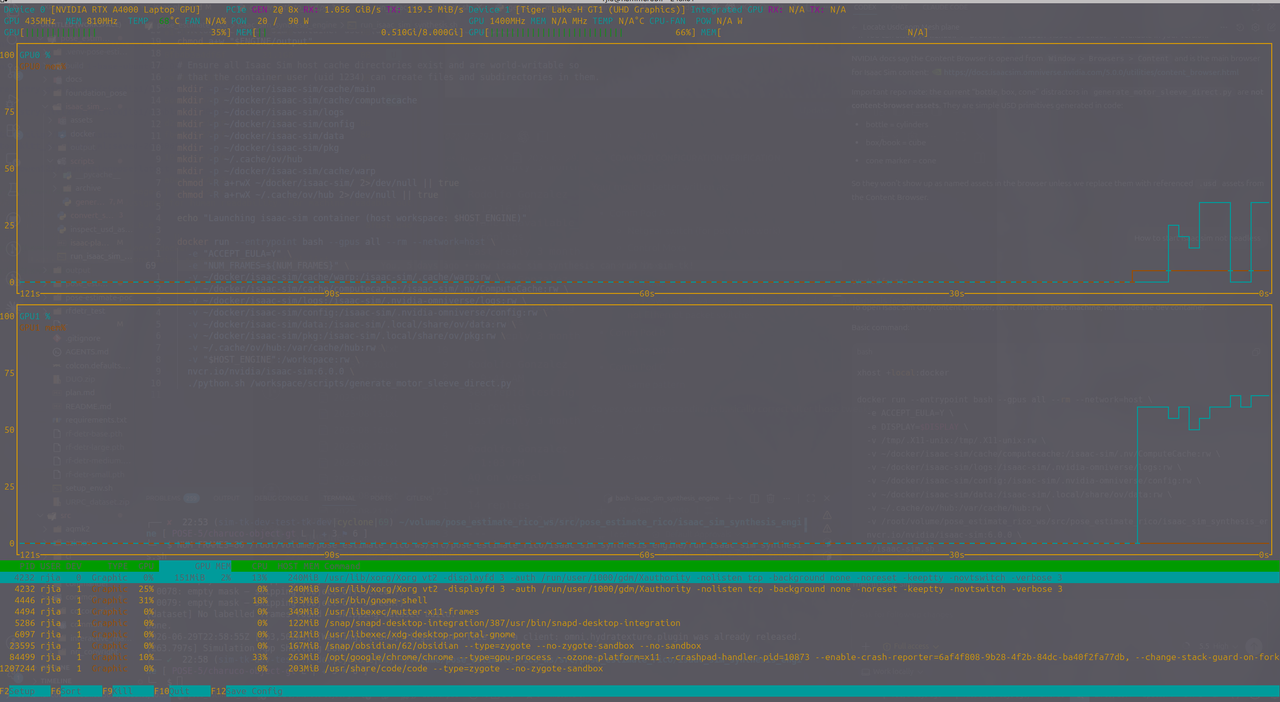
This lists which process is using the GPU, like desktop rendering processes like xorg, gnome-shell, chrome, vscode, obsidian, etc.
How do you genreate a photo realistic pipeline
- is it common to add other objects?
-
I can see spheres and boxes
- TODO: need to make distance farther.
- TODO: organize images into
1
2
3
4
5
6
7
8
9
10
11
12
13
14
xhost +local:docker

docker run --entrypoint bash --gpus all --rm --network=host \
  -e ACCEPT_EULA=Y \
  -e DISPLAY=$DISPLAY \
  -v /tmp/.X11-unix:/tmp/.X11-unix:rw \
  -v ~/docker/isaac-sim/cache/computecache:/isaac-sim/.nv/ComputeCache:rw \
  -v ~/docker/isaac-sim/logs:/isaac-sim/.nvidia-omniverse/logs:rw \
  -v ~/docker/isaac-sim/config:/isaac-sim/.nvidia-omniverse/config:rw \
  -v ~/docker/isaac-sim/data:/isaac-sim/.local/share/ov/data:rw \
  -v ~/.cache/ov/hub:/var/cache/hub:rw \
  -v /root/volume/pose_estimate_rico_ws/src/pose_estimate_rico/isaac_sim_synthesis_engine:/workspace:rw \
  nvcr.io/nvidia/isaac-sim:6.0.0 \
  ./isaac-sim.sh