Introduction
GDB is EXTREMELY handy. I used to doing a lot of print statements, but now I use GDB a lot. The reason is simple: I can check multiple things at once without recompiling everytime, especially my compilation time is long.
Concepts
Debug Symbols in C or C++ are mappings from machine code to function names, variable names, line numbers, etc.
E.g., in a binary, i is just a memory location. When built with a Debug flag (see the Usage section), we know the variable’s name.
1
int i = 1;
Debugging symbols do not impact the binary execution logic. It’s purely informational and consumed by gdb. The binary filesize though would increase.
Compilation
- In
CMakeLists.txt
1
set(CMAKE_BUILD_TYPE Debug)
1
- Or alternatively, `catkin_make -DCMAKE_BUILD_TYPE=Debug`
- In
gcc:
1
gcc -g -o myprog myprogram.c
Run GDB
- In a ROS Launch file:
1
<node pkg="rgbd_slam_rico" type="rgbd_rico_slam_mini" name="rgbd_rico_slam_mini" output="screen" launch-prefix="gdb -ex run --args"/>
- Alternatively, you can run the binary using the command
gdb:
1
gdb ./devel/lib/<PACKAGE_NAME>/binary
- If there are args:
1
gdb --args BINARY --arg1 <val1> --arg2 <val2>
GDB Usage
Some common usages include:
b <FILE_NAME>:<LINE_NUM>set a breakpointr: runc: continuep <var_name>: print a variable nameinfo breakpoints: check which breakpoints are availabledelete <BREAKPOINT_NUM>: to delete a break point’s number
Some cautions:
- When debug printing an element in a
cv::Mat, we need to specify its data type. To print it as a:- double (
CV_64F), do(gdb) x/4g var. 4 means the first 4 values,gmeans double precision. - float (
CV_32F):(gdb) x/4f var - int:
(gdb) x/4d var
- double (
With ROS2
1
2
3
4
5
6
7
8
9
10
colcon build --symlink-install --cmake-args -DCMAKE_BUILD_TYPE=Debug
gdb --args ./test_direct_3d_ndt_lo --gtest_catch_exceptions=0

# 5 In gdb:
(gdb) catch throw   # break on any C++ throw
(gdb) run
# gdb will now break inside std::_Deque_base<...>::_M_range_check
# you can then:
(gdb) bt           # to see the backtrace
(gdb) info locals  # to inspect variables
Core Dump
Assume we have multiple C++ nodes that crash after running a long time (so they are hard to reproduce). What would be a good way to start debugging?
- Core dump
A “core dump” is a snapshot of a computer program’s memory state, typically taken when the program crashes or terminates abnormally, and it’s used to help diagnose the cause of the crash.
- How to get it working:
ulimit -c unlimited-
Adjust kernel settings to store it in /tmp:
1
 cat /proc/sys/kernel/core_pattern
- To change it:
sudo sysctl -w kernel.core_pattern=/tmp/core.%e.%p.%h.%t -
/etc/systemd/system.conf1
DefaultLimitCORE=infinity
sudo systemctl daemon-reload-
Create a crash program:
1
2
3
4
5
6
7
 #include <stdio.h>
 int main() {
     // Intentionally dereference a NULL pointer to cause a segmentation fault.
     int *ptr = NULL;
     *ptr = 42;
     return 0;
 }
-
Compile the executable with debugging symbols:
1
 gcc -o0 crash_example crash_example.c
- Temporarily Enable Core Dumps:
ulimit -c unlimited - Verify that the current core dump file name pattern with:
cat /proc/sys/kernel/core_pattern - Run the program:
./crash_example - Launch gdb:
gdb ./crash_example /tmp/core.<executable_name>.<pid>.<hostname>.<timestamp>: and runbtat gdb. There will be backtrace saved
DDD
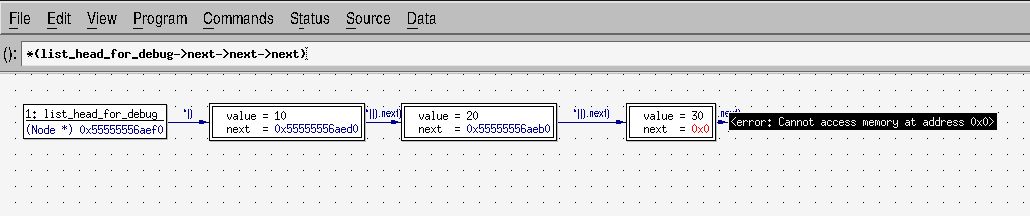
DDD is a wrapper around gdb that provides a way to check data structures graphically (which is better than VSCode). In the below example, we can see value of each node by clicking on each one of them:
1
2
3
4
5
6
7
8
9
10
11
12
13
14
15
16
17
18
19
20
21
22
23
24
25
26
27
28
29
30
31
32
33
34
35
36
37
38
39
40
41
#include <iostream>

struct Node {
    int value;
    Node* next;
    Node(int v, Node* n = nullptr) : value(v), next(n) {}
};

Node* push_front(Node* head, int value) {
    return new Node(value, head);
}

int sum_list(Node* head) {
    int sum = 0;
    for (Node* p = head; p != nullptr; p = p->next)
        sum += p->value;
    return sum;
}

void free_list(Node* head) {
    while (head) {
        Node* tmp = head->next;
        delete head;
        head = tmp;
    }
}

int main() {
    Node* head = nullptr;
    head = push_front(head, 30);
    head = push_front(head, 20);
    head = push_front(head, 10);  // List: 10 -> 20 -> 30 -> NULL

    std::cout << "sum=" << sum_list(head) << "\n";

    // Good place for a breakpoint in DDD:
    Node* list_head_for_debug = head;

    free_list(head);
    return 0;
}
Makefile:
1
2
3
4
5
6
7
8
9
10
CXX = g++
CXXFLAGS = -g -O0 -Wall -Wextra -std=c++11

all: llcpp

llcpp: example.cpp
        $(CXX) $(CXXFLAGS) -o llcpp example.cpp

clean:
        rm -f llcpp
Now create a break point, open display and create a data pane, by clicking on each node, one can see: