Networking Layers: From DDS Payload to Wire Format
When we talk about “sending a DDS message,” it’s easy to think of it as a single thing moving across the system. In reality, networking is layered. Each layer wraps the one above it.
At a high level:
1
2
3
4
5
Application  →  DDS / ROS 2
Transport    →  UDP or TCP
Network      →  IPv4 or IPv6
Link         →  Ethernet / WiFi / Loopback
Each layer has a specific responsibility.
-
DDS / ROS 2 defines the application-level message format and semantics.
-
UDP or TCP handles transport (ports, reliability, segmentation behavior).
-
IPv4 / IPv6 handles addressing and routing between hosts.
-
Ethernet / WiFi / Loopback handles delivery on a specific link.
Ethernet and NIC
NIC = Network Interface Controller; The ethernet card is by far the most common type of NIC. It’s often integrated on the motherboard, but equivalently, it’s equivalent to going through the PCIe switches. On laptops, there are usually 1 ethernet ports (and an associated ether card), on desktops, there could be 2.
- PCIe = Peripheral Component INterface Express, a high-speed interface for external components to talk to the motherboard. Common components include: GPU, NVMe SSD, Network Cards, etc.
Since Ubuntu 16.04, predictable network-interface was introduced. An ethernet NIC is
1
2
3
4
en[p]<bus-number>s<slot-number>[f<function>]
└─┬──┘ └──┬─────┘
  │        └─── “device 0 in PCI slot 3”
  └──────────── “Ethernet” (as opposed to wl… = Wi-Fi, lo = loopback)
So enp3s0 means “Ethernet adapter located on PCI bus 3, slot 0, function 0”. On another PC you might see names like enp5s0 or eno1. The NIC can be configured to an IP 192.168.1.xxx/24.
1
2
- A subnet mask is the `/24`. Devices with the same subnet mask can talk directly without a router
- `/24 is the ‘CIDR notation`
Case Study: Connecting Livox Mid 360
https://i.postimg.cc/RZr9PNSP/2025-06-29-14-16-38.png
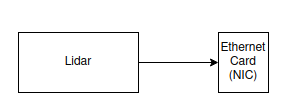
All Livox Mid- & Horizon-series sensors come with a fixed IP in the 192.168.1. range (/24 mask).
- Upon connection, LiDAR negotiates speed/duplex w/ NIC
- LiDAR will start publishing UDP packets.
The configuration steps include:
- Checking for the NIC name:
1
2
3
4
$ ip a
eno1: <NO-CARRIER,BROADCAST,MULTICAST,UP> mtu 1500 qdisc mq state DOWN group default qlen 1000
    link/ether cc:28:aa:45:68:bd brd ff:ff:ff:ff:ff:ff
    altname enp8s0
- Connect the device
- Checking if the physical link from the livox is up -
NIC Link is Up 100 Mbps Full Duplexshows it’s up now
1
2
3
ricojia@system76-pc:~/Downloads/LivoxViewer2 for Ubuntu v2.3.0$  sudo dmesg | grep -i -e eno1 -e enp8s0
[    1.812914] igc 0000:08:00.0 eno1: renamed from eth0
[80870.168221] igc 0000:08:00.0 eno1: NIC Link is Up 100 Mbps Full Duplex, Flow Control: RX
- To confirm auto-negotiation is valid:
1
2
3
sudo ethtool eno1  # ^--- look for "Link detected: yes/no", negotiated speed/duplex
    ...
 Supports auto-negotiation: Yes
- Disable ufw:
sudo ufw disable(Livox Viewer2 would not be able to get point clouds otherwise)
Network Loop
If Two network switches are connected, and if STP (Spanning tree??)is not configured correctly? There would be a network loop. traffic will broadcast; get come back around. There will be massive packet duplication. So you might see some ros2 calls sometime fail.
1
2
3
Switch A ───── Switch B
│ │
└──────────────┘
- what is spanning tree protocol? STP???
- Layer 2 netowrk protocol that Detects switch loops, and automatically keeps only one active path between switches
- Diagnosis:
ip -s link= ;ppl fpr jige RX package counts, with dropped packets.
- Fix:
- Remove redundant cable
- Enable STP/RSTP
Wireshark
Wireshark is a network protocol analyzer that captures and inspects packets traveling over a network, allowing you to examine source and destination IPs, protocols like TCP/UDP/HTTP, payload data (when not encrypted), and packet timing and sequencing. It’s commonly used for debugging network issues, analyzing traffic, and security investigations.
The data it captures is stored in a .pcap (packet capture) file, which is simply a recorded snapshot of network traffic that Wireshark can either generate from live captures or open for later analysis. While Wireshark itself is primarily a GUI tool, packet capture is often done via the command line using tools like tcpdump or tshark.
For example, you can capture traffic with sudo tcpdump -i eth0 -w capture.pcap or sudo tshark -i eth0 -w capture.pcap, where -i specifies the network interface (use any if unsure) and -w writes the captured packets to a .pcap file.